

A team grows from four developers to six, but deliveries rise only slightly. Should we conclude that the new people are not good at their jobs, or first check whether the whole team is waiting on the same step?
Manufacturers face a similar question. They can add people to prepare parts, but there is still only one machine for a critical step. Production economics helps separate the effect of adding one resource from a change to the whole system before headcount becomes the answer to every problem.
The short run is a period when some inputs cannot yet change
At least one input is fixed in the short run; all inputs can be changed in the long run. “Fixed” means constrained within the period of the decision, not impossible to change forever.
A systems integration (SI) team might add a subcontractor this month but cannot train another reviewer who understands the existing system in time. A factory might add people to a shift but cannot order and install a new machine by next week. Both are short-run production cases, even though the time needed to change the constraint differs between businesses.
When there is time to train people, change the process, or choose a new machine, long-run options open up. Defining the period by what can change keeps an urgent work fix separate from an investment for the future. OpenStax 7.2, linked at the end, explains the short-run and production terms further.

Separate total, average, and marginal product
Total product is all the output produced with a given set of inputs during a defined period. Average product per worker is total product divided by the number of workers. Marginal product is the change in total product when one unit of an input is added while other inputs stay fixed.
These three measures answer different questions. A team can deliver more in total while output per person falls. The latest person added may increase the team's output by less than the previous addition did, without the team's total output falling.
Scroll the table left and right to read every column.
| Workers on shift | Total good units per shift | Average good units per worker | Output added by the latest worker |
|---|---|---|---|
| 2 workers | 80 units | 40 units/worker | Not calculated; there is no one-worker shift to compare |
| 3 workers | 126 units | 42 units/worker | 46 units/additional worker |
| 4 workers | 160 units | 40 units/worker | 34 units/additional worker |
| 5 workers | 180 units | 36 units/worker | 20 units/additional worker |
Assume one type of part, the same quality standard and shift length, comparable skills and materials, and no change in machines. This table was made to explain the calculation, not drawn from a real factory.
Moving from three to four workers adds 160 - 126 = 34 units per shift. Moving from four to five adds 180 - 160 = 20 units per shift. Marginal product falls, but total good output still rises from 160 to 180. That is different from saying another worker made output fall.
Diminishing marginal returns depend on conditions
As a variable input such as labor is added while other inputs remain fixed, the output added by each further unit may eventually decline. This is diminishing marginal returns. It does not say every new hire makes things worse. At first, dividing the work may even raise marginal product.
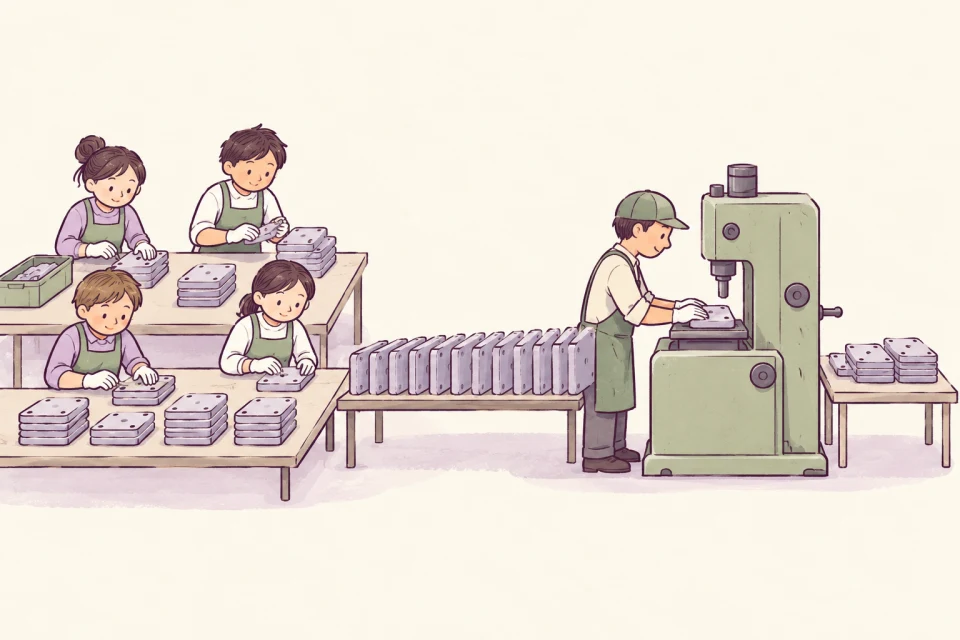
In the table, additional people can prepare parts and reduce waiting at first. As the existing machine approaches a full shift, more people may have to wait for it. Another worker then adds fewer good parts than before. That explanation assumes the machine has not changed.
If the machine, skills, process, or type of work changes at the same time, we cannot attribute the before-and-after numbers to the added worker alone. Record what else changed and explain the limits of the comparison.
Software work needs more care in choosing an output measure
One task may change text on a screen; another may connect an accounting system that requires checks against historical data. Closing the same number of tasks does not make the work equal. Lines of code do not show how much better a customer can use the system.
An Odoo Partner might begin by measuring the time from a clear requirement to user acceptance, comparing similar types of work. It could track time waiting for design review, data, testing, and fixes after delivery. Using a standard feature instead of writing custom code may also deliver a result with fewer lines.
Suppose a team finishes 12 comparable tasks a week but reviewers accept only 8 during the same period. If 12 new tasks keep entering every week, the queue before review grows by a net four tasks per week. Adding developers without increasing review capacity may lengthen that queue even while everyone is busy full-time.
This applies the idea of a system constraint. It does not prove that every software team's output follows the factory table. Reviewers may be facing harder tasks, or customer information may be missing. Look for the real cause of waiting before choosing a fix.
Ask where the work is stuck, not only how many people are missing
I would trace one piece of work from intake to delivery and record active work time separately from waiting time. Then choose the point that constrains delivery across the whole system. The busiest-looking step is not necessarily the constraint.
A software team might reserve firm time for design review, prepare sample data before development, or train another reviewer. A factory might set up tools before stopping a machine, reduce rework, or sequence batches to require fewer changeovers. Test whether each option increases good units actually delivered or merely moves the queue elsewhere.
Before hiring, say which constraint the new person will relieve and how delivery will show the effect. “Everyone is busy” is not yet enough information to choose a solution.
Set a trial period and quality conditions too, perhaps comparing similar tasks with their rework and watching the load on the next step. Speeding up the beginning only to leave more work stuck at the end is not a success for the whole system.
Episode 3 follows these resources into costs, especially expenses visible in the accounts and opportunity costs that are not shown there.
Common questions
Do diminishing marginal returns mean we should stop hiring immediately?
Not necessarily. Compare the value of added output with the relevant cost, while considering quality and workload. A falling marginal product describes a relationship between input and output. It cannot decide whether the addition is worthwhile without price and cost information.
Does the long run have to be longer than a year?
There is no fixed one-year threshold in this definition. It depends on how long the business needs to change all production inputs. Being able to change every input does not remove budget, time, or risk from the decision.
Sources used to check the concepts
This article explains the short run and long run, total product, average product, marginal product, and diminishing marginal returns. The definitions and conditions of the model can be checked against OpenStax 7.2 below. The software, SI, Odoo Partner, and manufacturing cases are hypothetical applications I use to explain the ideas, not output data from real organizations.
Read OpenStax 7.2 on short-run production and marginal product