
Sales grow, but you still need money for stock and payroll before customers pay. Revenue alone does not show how much profit the growth leaves, or how much more cash and assets it requires.
I want to connect those decisions: what to sell, to whom, at what price, and what it takes to deliver. That leads to costs, receivables, inventory, and machinery, before we assess return on assets, or ROA.
Strategy changes profit and the assets required
A volume strategy may accept less profit per sale, expecting enough sales to make it worthwhile. A differentiated offer needs evidence that customers will pay for the difference and that the extra revenue covers development, service, and delivery costs. Test price and volume in the actual market. Higher prices do not automatically mean fewer sales.
Different sales models also require different assets. Growth may need more inventory, customer credit, or equipment. Matching work to existing capacity may let sales grow without proportionate investment. Ask whether profit is keeping pace with the resources committed.
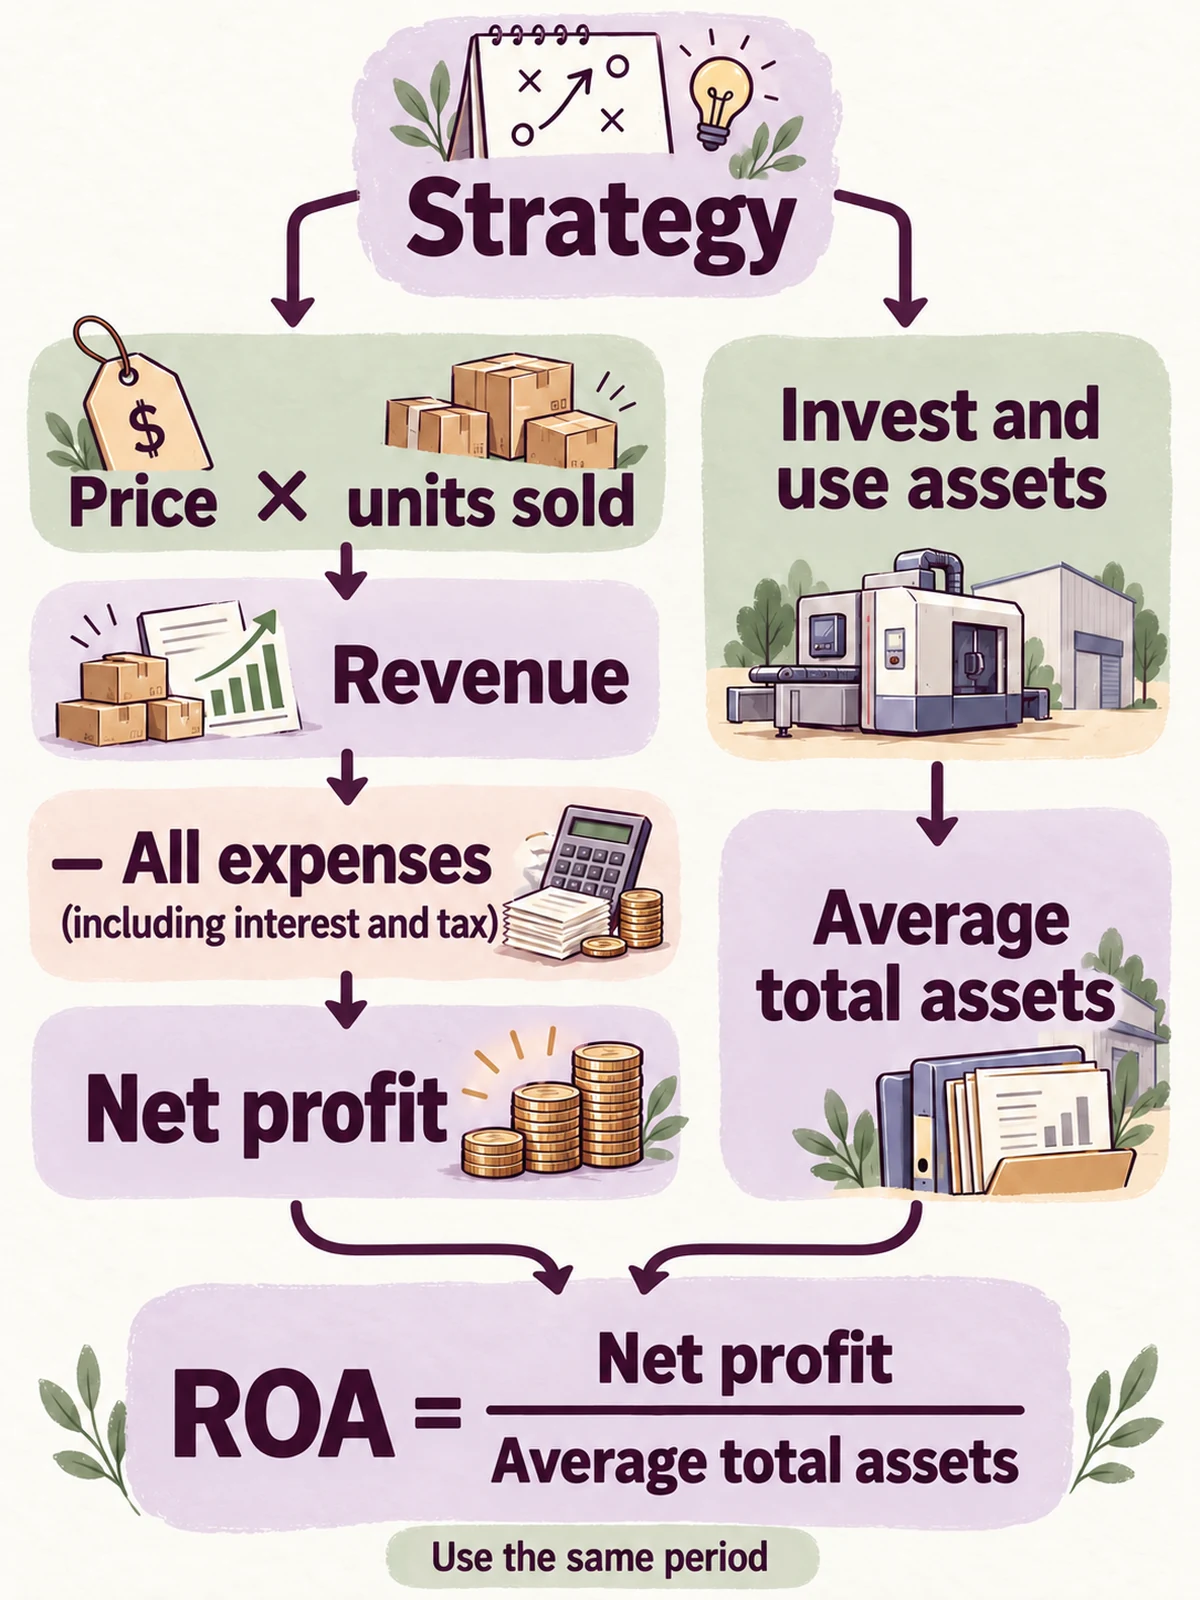
The diagram connects strategy with sales and costs, then asset use and ROA. Read both sides together: a higher margin may require a larger asset base.
Different sales models can produce the same ROA
Consider two hypothetical alternatives, separate from the financial-ratios series company. Each covers 12 months, uses THB 10 million in average total assets, and earns THB 1 million net profit after interest and tax.
| Item | A | B |
|---|---|---|
| Price per unit (THB) | 500 | 1,000 |
| Units sold during the year | 40,000 | 10,000 |
| Revenue (THB millions) | 20 | 10 |
| Total expenses, including assumed interest and tax (THB millions) | 19 | 9 |
| Net profit (THB millions) | 1 | 1 |
| Average total assets (THB millions) | 10 | 10 |
| Net profit margin | 5% | 10% |
| Total asset turnover | 2 times | 1 time |
| ROA | 10% | 10% |
A sells more units and earns more revenue, retaining THB 5 per THB 100 of sales; B retains THB 10. Both earn THB 1 million on THB 10 million average assets, so their returns match. This does not establish equal risk, cash, or quality. The products are not assumed to be identical.
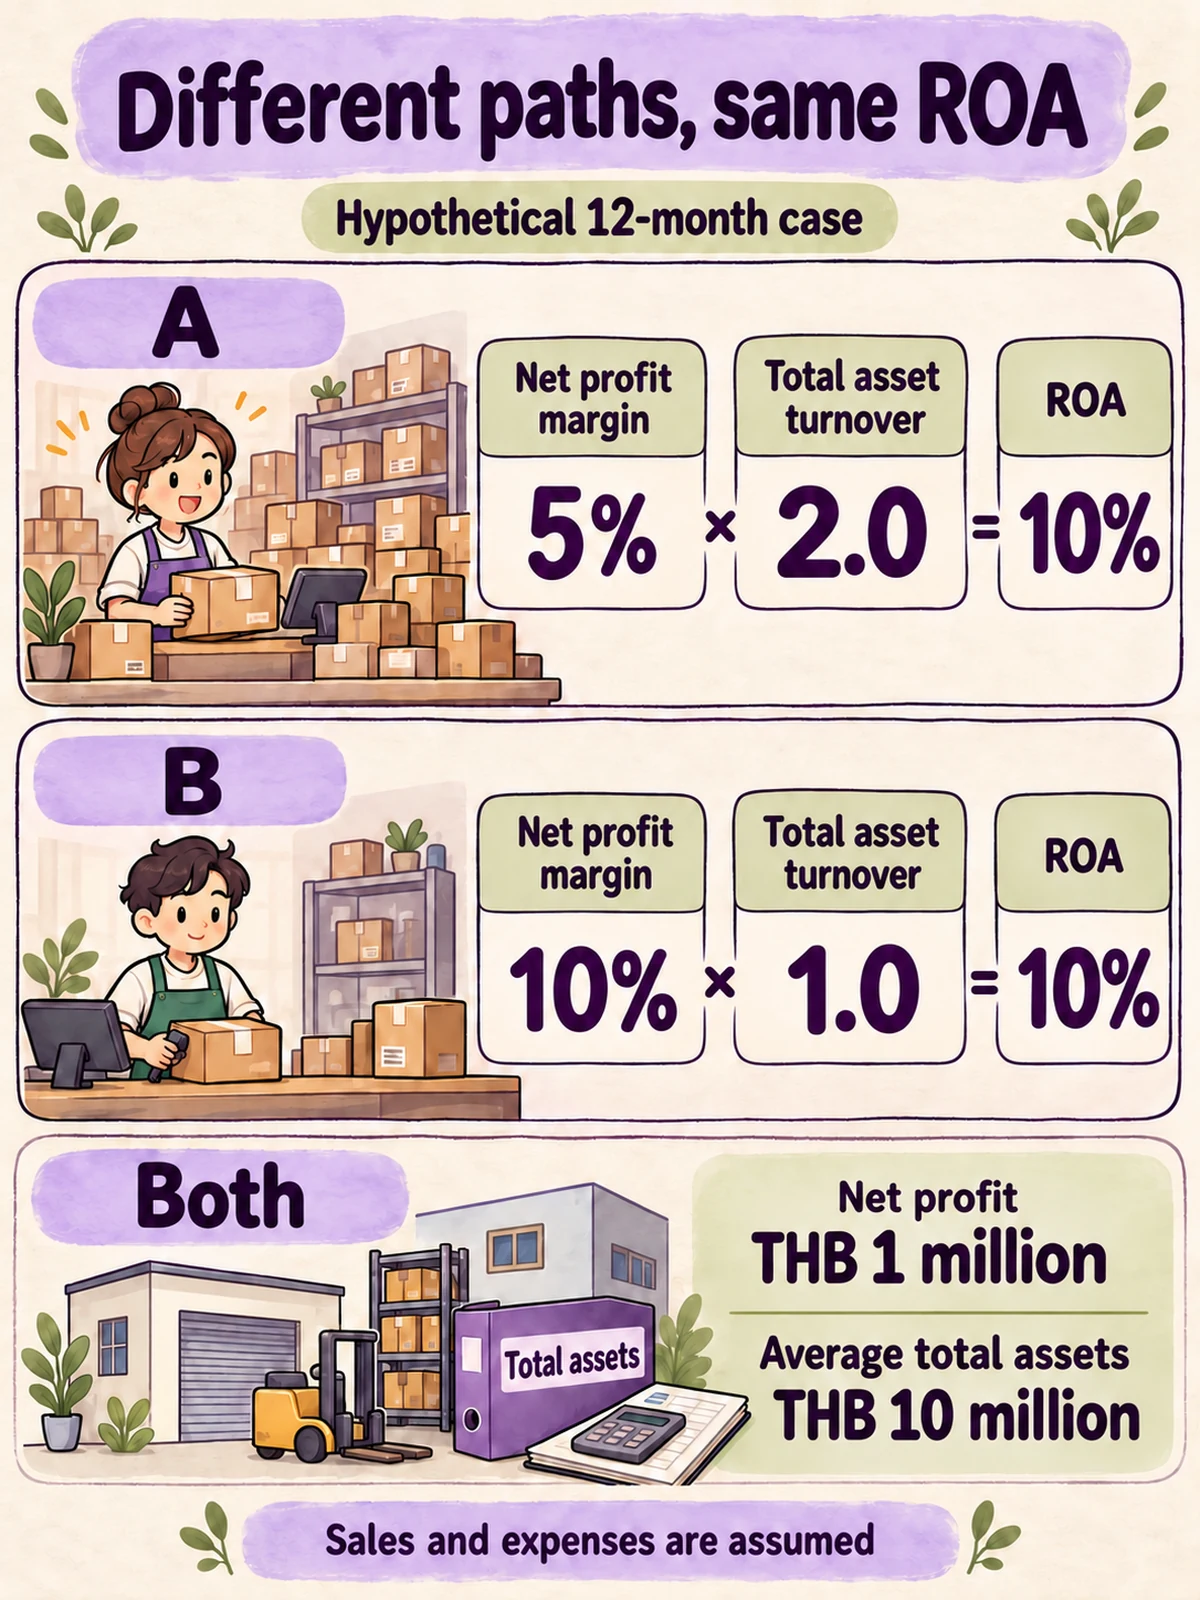
Here, ROA = net profit ÷ average total assets. It can also be expressed as net profit margin multiplied by total asset turnover, using revenue, profit, and assets for the same period.
A produces 5% × 2 = 10%; B produces 10% × 1 = 10%. Turnover of 2 means annual revenue is twice average total assets. It does not mean inventory sold out twice or customers paid quickly. The equal asset bases are a control assumption. Check whether actual growth requires more assets.
Profit can arrive before customer cash
Use a separate hypothetical example to examine timing, excluding tax and interest. A business buys goods for THB 70,000 cash, then delivers them on credit for THB 100,000. Assume all revenue-recognition conditions are met, the goods cost THB 70,000, and there are no other expenses.
On delivery it records THB 100,000 revenue, THB 30,000 profit in this example, and THB 100,000 receivables. It has collected nothing. Looking only at these transactions, THB 70,000 has already left the bank. Later collection turns the receivable into cash; it does not create another sale or another profit, or automatically reduce total assets.
Profit and cash answer different questions. Profit reflects recognized revenue less expenses; cash shows when money enters or leaves. An invoice alone proves neither that revenue can be recognized nor that payment has arrived. Check delivery, contract conditions, and payment evidence separately.
If the next stock order or payroll falls due before the previous customer pays, growth may tighten cash. Read receivables and cash flows alongside ROA. Cash-flow reporting accounts for noncash items and timing differences when explaining operating cash flows. See the IFRS Foundation's IAS 7 overview.
Profit and cash arrive at different times
An illustrative credit sale that qualifies for revenue recognition
Revenue less all expenses for the period gives net profit
Find out which assets are waiting
A receivable may await its due date, missing paperwork, or resolution of a customer dispute. Each needs a different response. Separate inventory held for planned orders from old goods with no sales plan. Read aging, collectibility, and condition before relying on totals.
An idle machine may await orders, repairs, or another production stage. Check bottlenecks and usable capacity before pushing sales or buying equipment. Assess the accounting effect, cash proceeds, and delivery capacity before retiring or selling equipment. Cutting the asset base to improve a ratio may damage future opportunities.
Short-term action might address scheduling, billing documents, or collection. Long-term investment may precede revenue, so track capacity plans, cash, and returns through the investment period. These are decision horizons, not different ROA formulas. Labor hours also need managing, but are not automatically balance-sheet assets.
Before raising the next sales target
Have sales, delivery, and finance examine the same jobs. What profit does each leave? How much must be paid before collection? Which assets will grow or become idle? For new investment, identify the work or demand expected to use the capacity, its timing, and the evidence supporting it.
For ROE, DuPont, and the two-year calculations, read Part 6 on ROA, ROE, and DuPont. This diagram-led article starts the business conversation: how will the next sales target change profit, cash, and assets?
Sources and scope
The definitions of total asset turnover, net profit margin, and ROA follow CFA Institute's Financial Ratio List, items 14, 18, and 20. Other reports may use different profit definitions; reconcile those before comparing. A/B and the credit-sale example are hypothetical illustrations of separate questions, not actual results or forecasts for any business.